You've invested in QR code marketing: flyers, posters, packaging, business cards. But how do you know if it's actually working? Measuring QR code campaign performance is the difference between hoping your print marketing is effective and knowing exactly how well each campaign performs. This guide shows you the metrics that matter and how to measure them.
Whether you're trying to count QR code scans, monitor campaign engagement over time, or calculate the ROI of your print materials, understanding QR code performance metrics gives you the data to optimise every future campaign.
Why Measuring QR Code Performance Matters
Print marketing has historically been difficult to measure. You distribute 5,000 flyers and hope they work, but you rarely know how many people actually engaged. QR codes with scan tracking solve this problem entirely.
When you measure QR code performance, you can:
- Prove ROI: show exactly how many people engaged with your print materials
- Compare campaigns: determine which materials, locations, or designs drive the most scans
- Identify trends: spot patterns in when and where people scan your codes
- Optimise spending: focus budget on what works and cut what doesn't
- Report with confidence: replace guesswork with hard data
Key Metrics for QR Code Campaign Performance
Not all metrics are equally useful. Here are the QR code scan statistics that actually matter for measuring campaign performance:
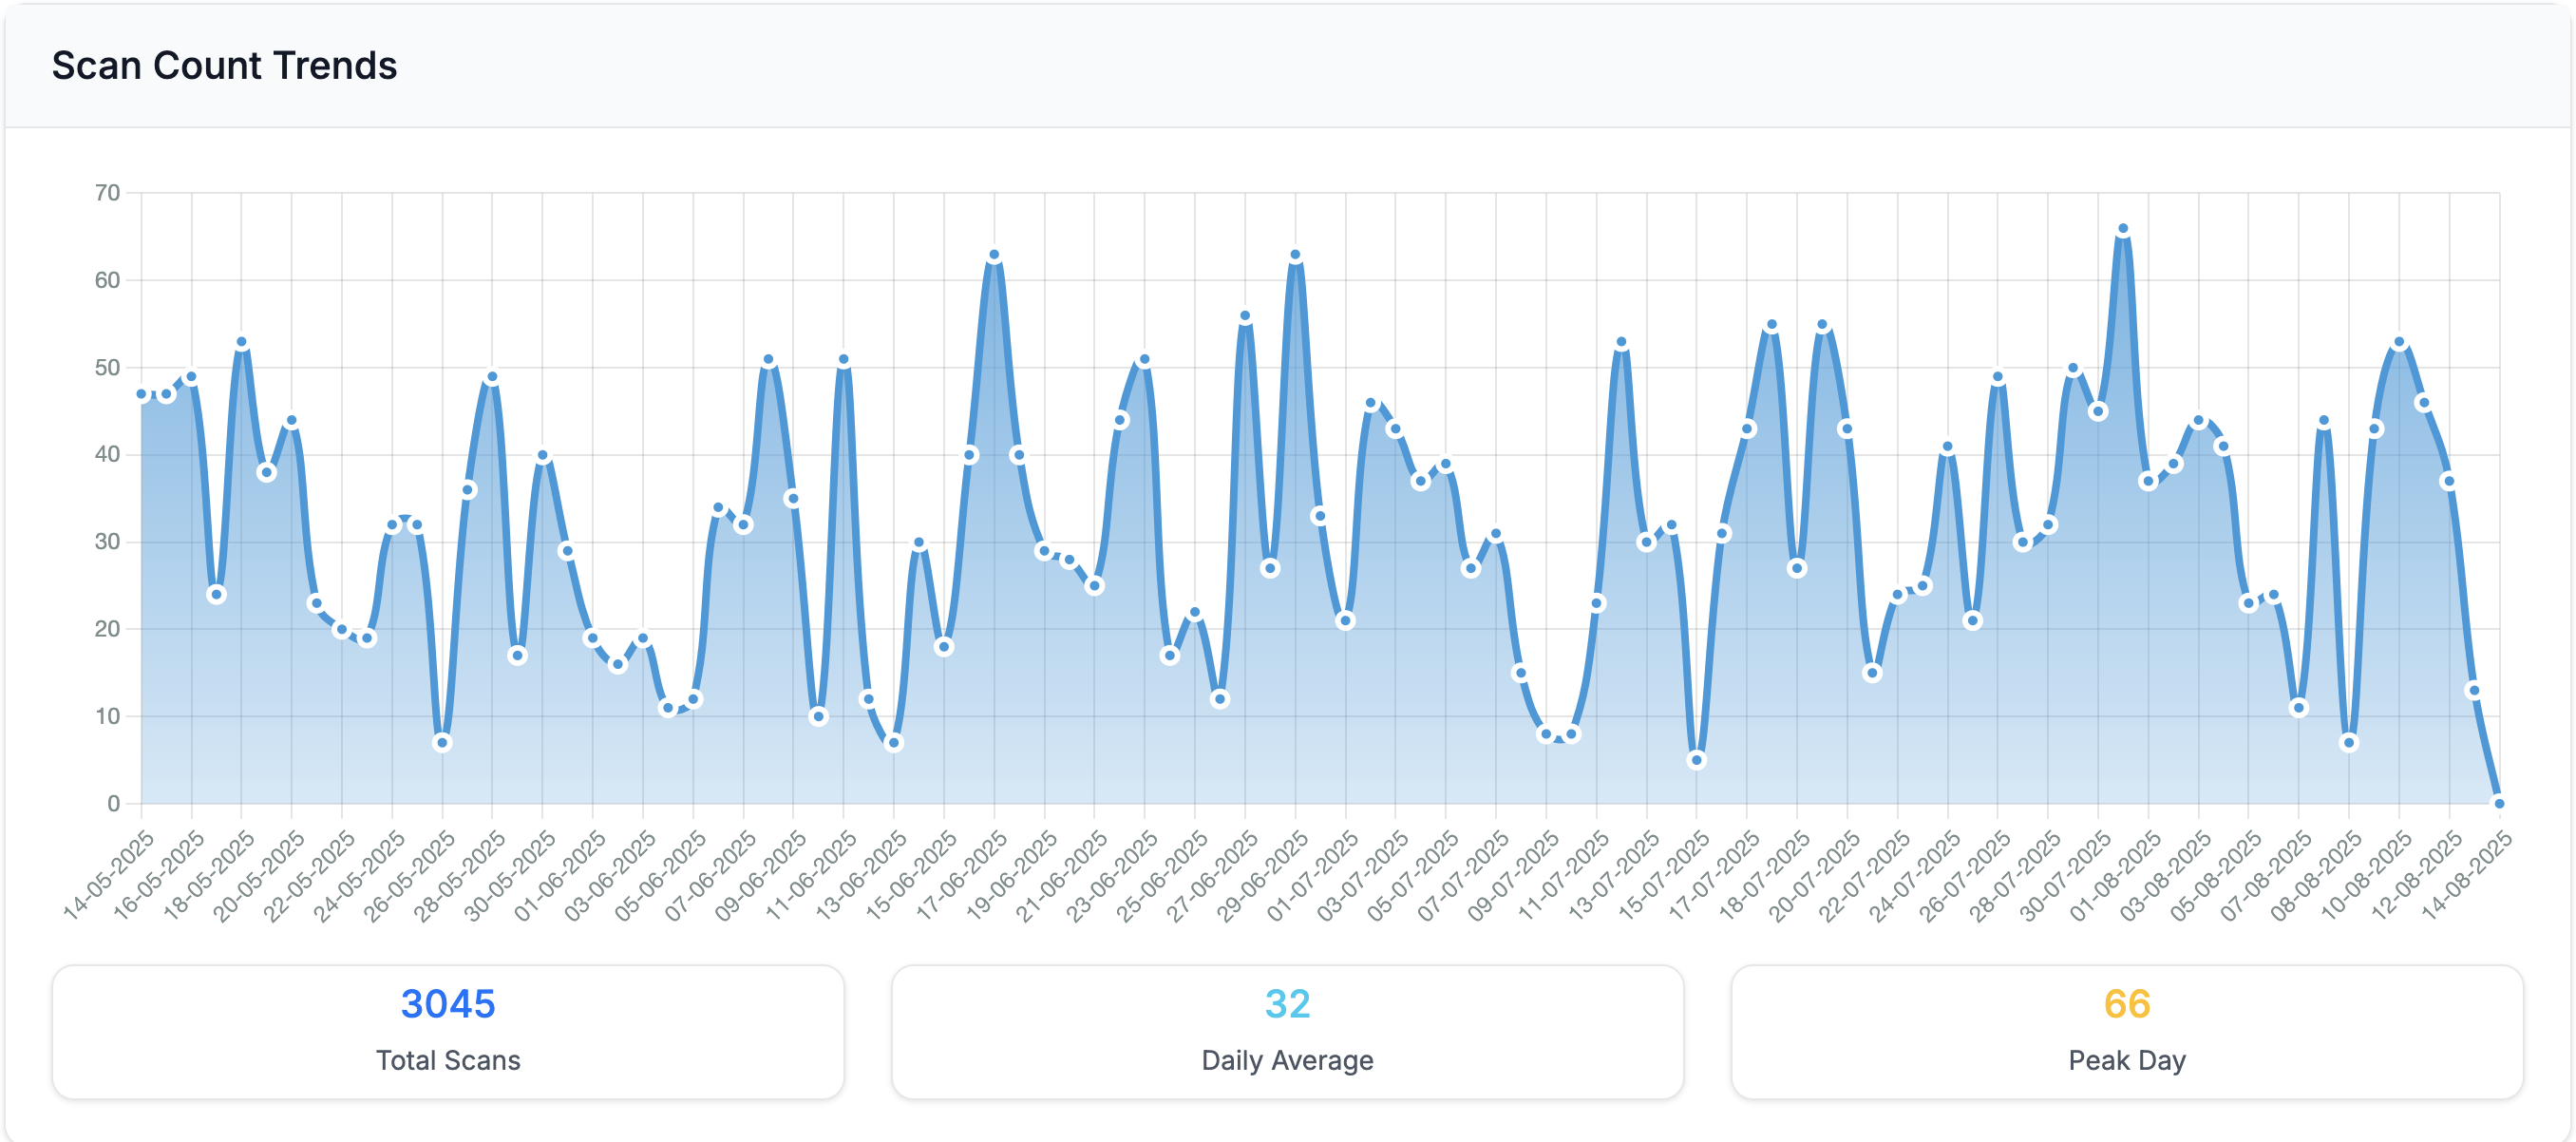
1. Total Scan Count
The most fundamental metric: how many times has your QR code been scanned? This tells you the raw volume of engagement your campaign is generating. Track this over time to see whether interest is growing, stable, or declining.
2. Unique vs Repeat Scans
Total scans tell you volume, but the unique-to-total ratio tells you about engagement quality. A high ratio of unique scans means you're reaching new people. A high ratio of repeat scans means your existing audience is highly engaged. Both are valuable in different contexts.
For a restaurant menu QR code, repeat scans are expected and healthy. For a one-time promotional campaign, you want mostly unique scans indicating fresh reach.
3. Scan Velocity
How quickly are scans accumulating? Scan velocity, the rate of scans per day or per week, reveals the momentum of your campaign. A sudden spike might indicate your flyers just hit a busy area. A gradual decline suggests your materials are aging out.
4. Geographic Distribution
Where are your scans coming from? Geographic scan data shows you which cities, regions, and countries generate the most engagement. This is critical for businesses with multi-location campaigns.
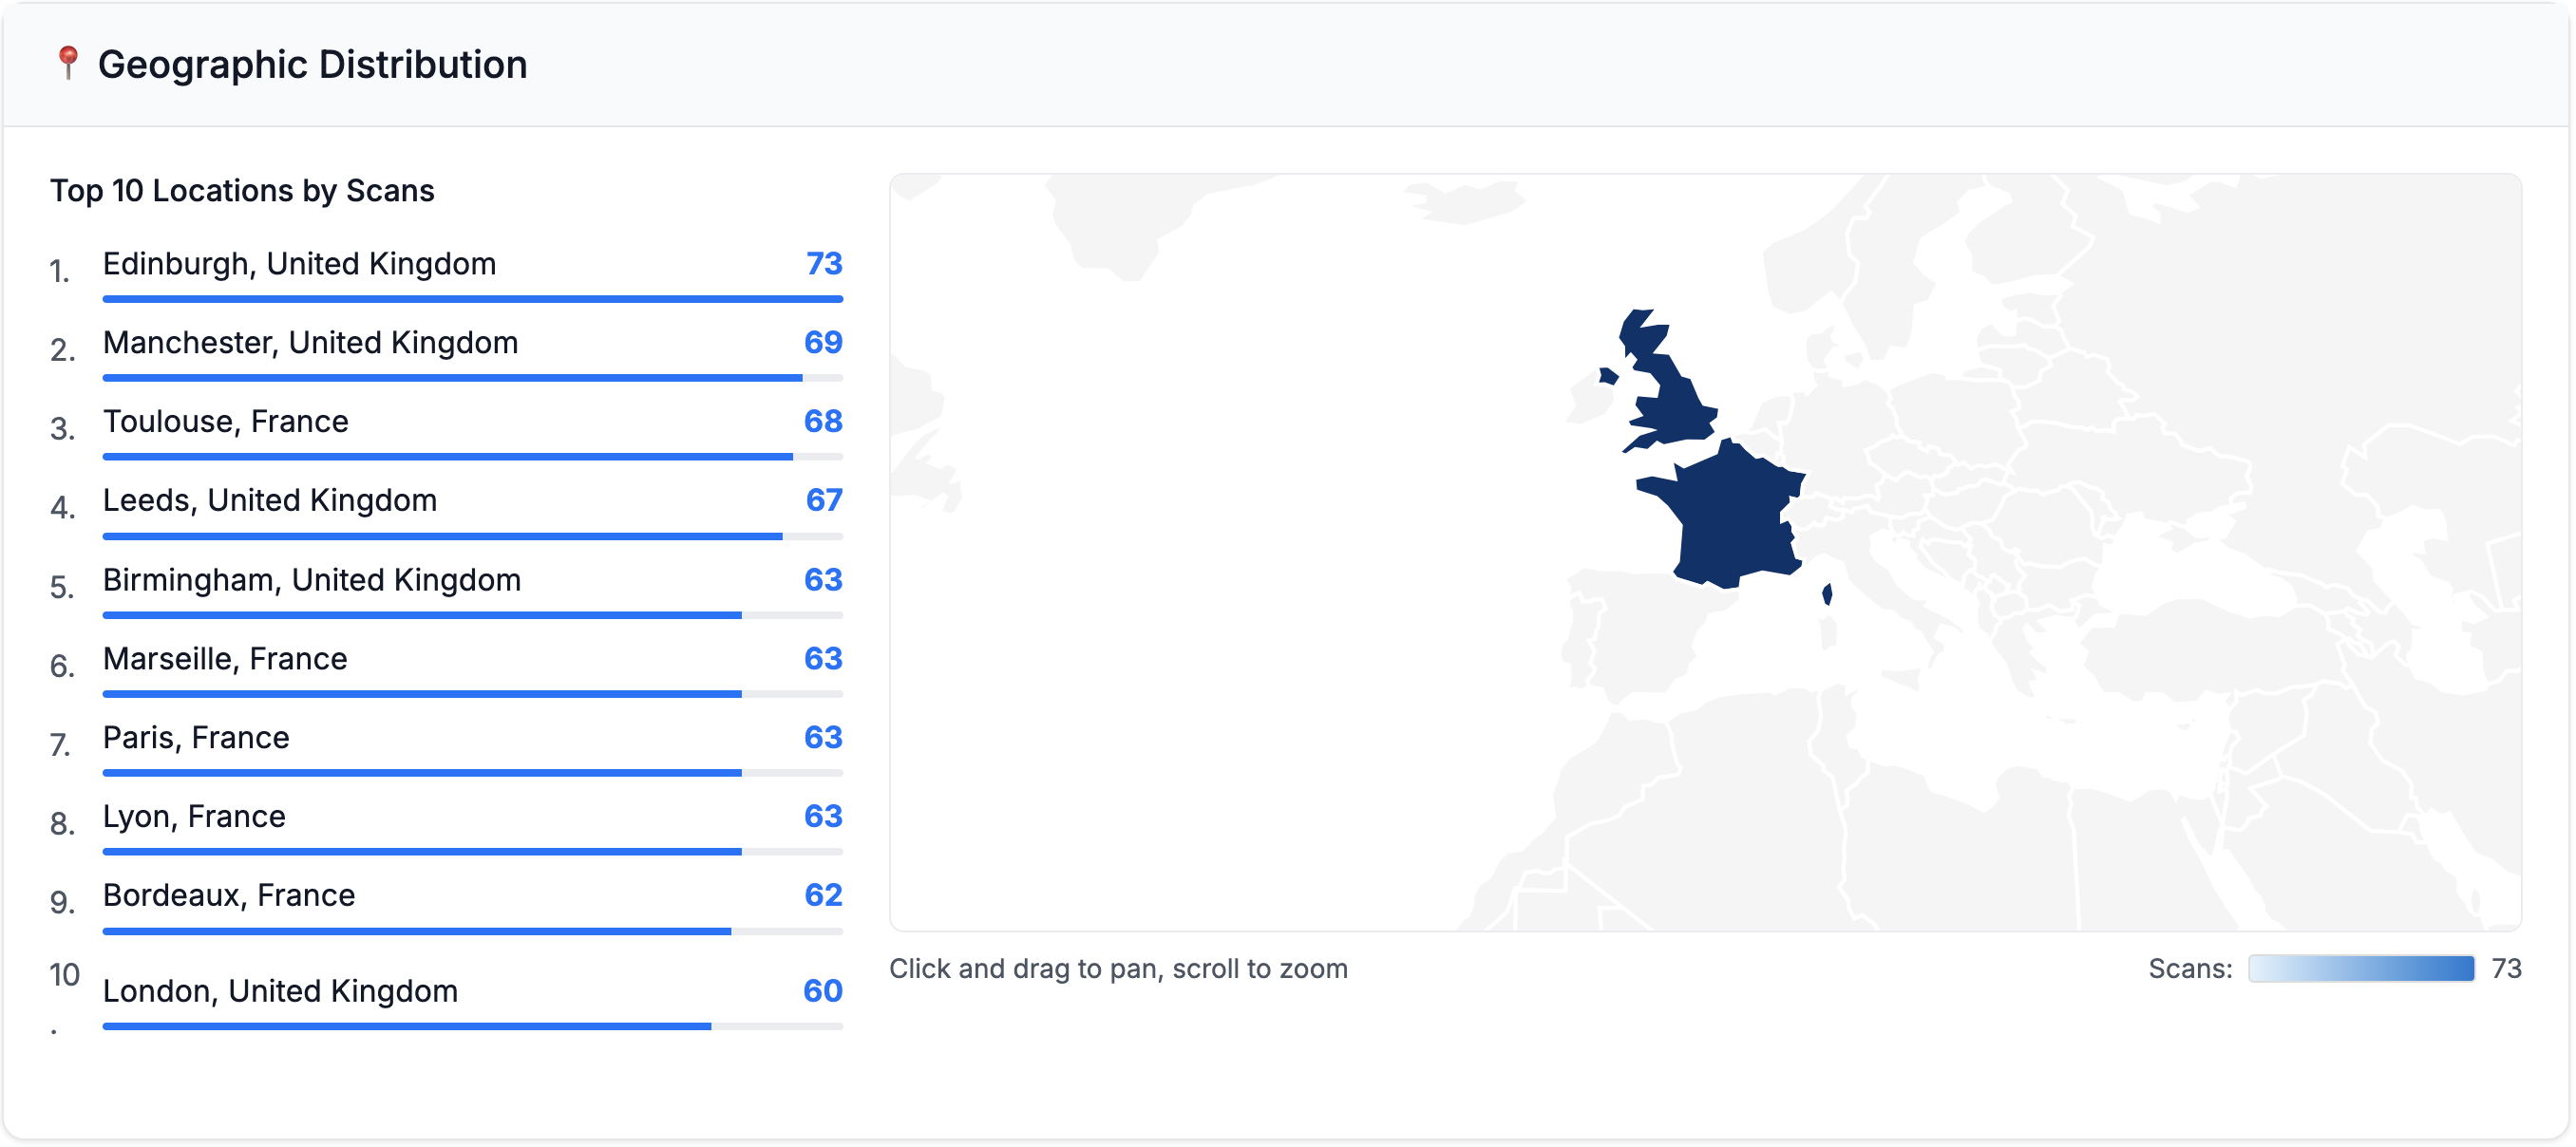
If you've placed QR codes in five different locations and one generates 10x the scans of the others, that's a clear signal about where to invest your marketing budget next time.
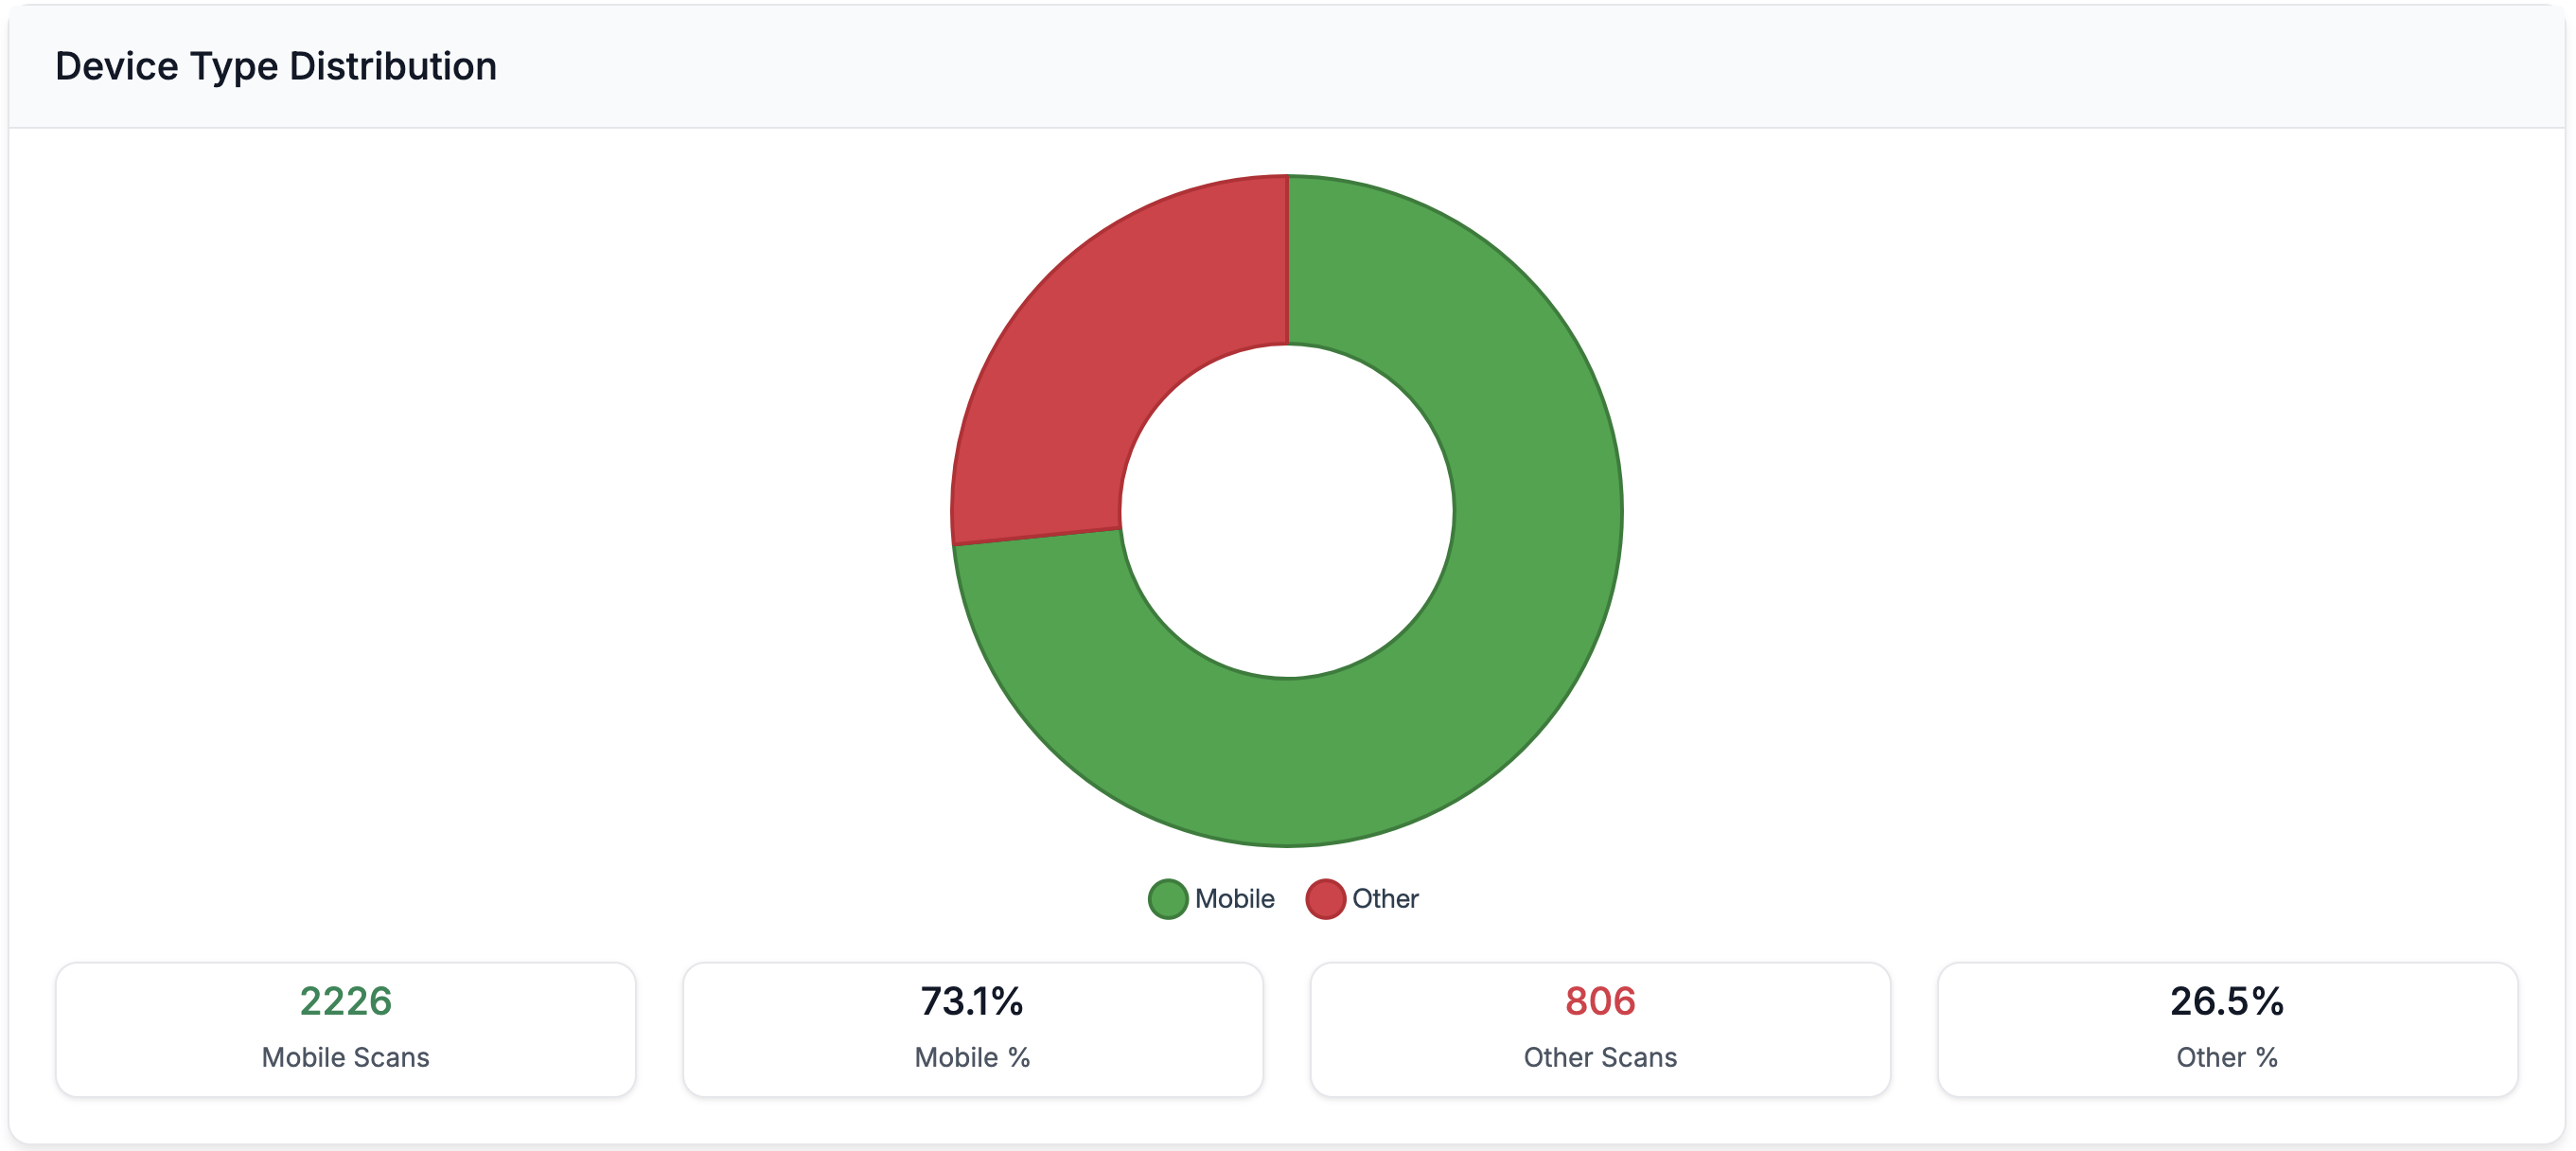
5. Device Type Split
The iOS vs Android breakdown of your scans provides indirect demographic insights. It also has practical implications for landing page optimisation. If 90% of scans come from iPhones, make sure your landing page is perfect on Mobile Safari.
6. Time-of-Day and Day-of-Week Patterns
When people scan your QR codes reveals behavioural patterns. Morning scans might indicate commuters. Evening scans could mean people browsing at home. Weekend versus weekday patterns help you understand your audience's routine.
How to Calculate QR Code Campaign ROI
With scan data in hand, you can calculate the actual return on investment for your print marketing:
Cost Per Scan = Total campaign cost / Total scans
If your flyer campaign costs £200 and generates 800 scans, your cost per scan is 25p. Compare this to your cost per click on digital ads to understand relative channel efficiency.
Cost Per Unique Scan = Total campaign cost / Unique scans
This gives you the cost per new person reached, a closer equivalent to cost per unique visitor in digital marketing.
Scan-to-Action Rate = Conversions from scan / Total scans
If your QR code links to a booking page and you can track bookings, this tells you how many scans convert to actual business outcomes.
Example ROI Calculation: A restaurant prints 500 table tent cards with QR codes (cost: £75). Over a month, the QR code generates 1,200 scans to their review page, resulting in 40 new Google reviews. Cost per review: £1.88. Compare that to the cost of any other review generation strategy. QR codes typically win on ROI.
Comparing Performance Across Campaigns
The real power of QR code performance measurement comes from comparing multiple campaigns. Create separate QR codes for each:
- Physical location: shop window vs counter vs packaging
- Material type: flyer vs poster vs business card
- Campaign period: January promotion vs February promotion
- Design variation: A/B test different calls-to-action
With each campaign on its own trackable QR code, your analytics dashboard becomes a performance comparison tool that shows you exactly what works best for your business.
Using AI to Interpret Performance Data
Raw numbers only tell part of the story. QR Insights includes AI-powered analysis that examines your scan patterns and provides contextual insights you might miss by looking at charts alone.
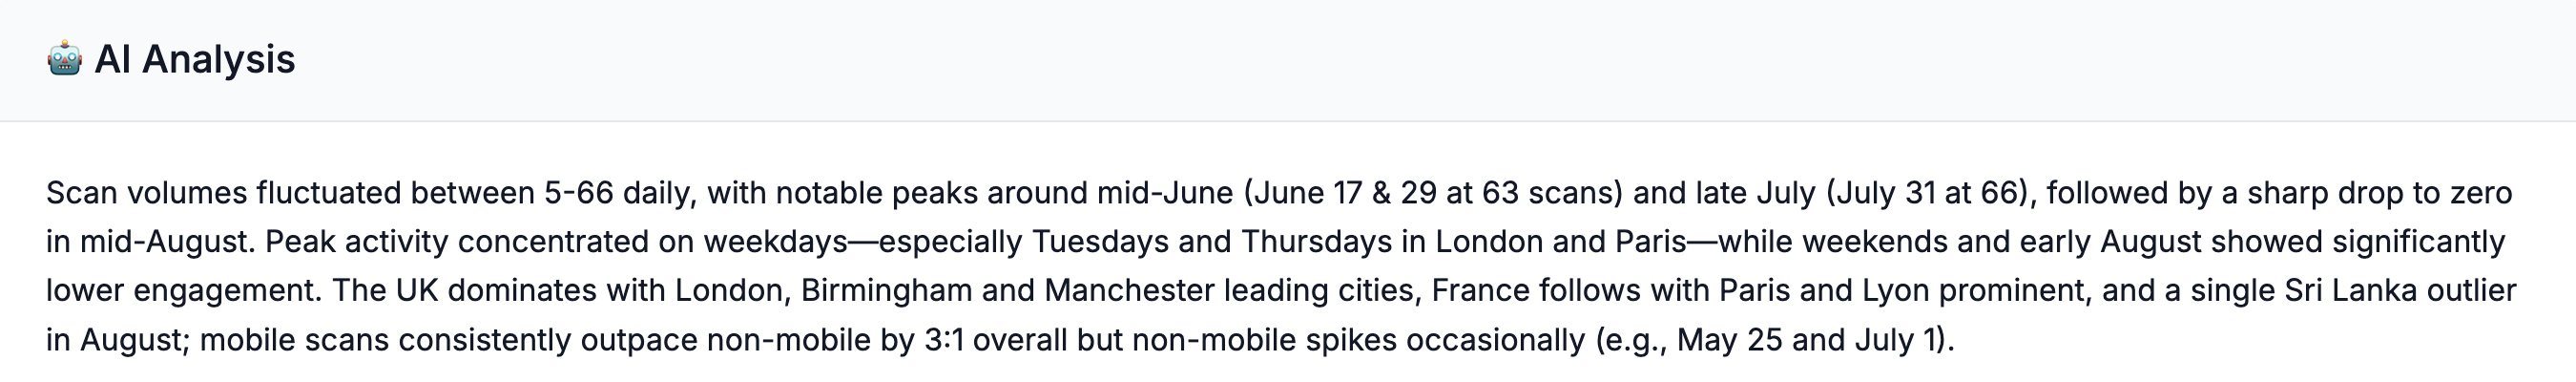
The AI might identify that your scans consistently drop on Wednesdays, suggest that a particular location is underperforming relative to foot traffic, or recommend testing a different landing page based on device distribution patterns.
Start Measuring QR Code Performance for Free
You can't improve what you don't measure. QR Insights gives you a free 30-day trial to measure every aspect of your QR code campaign performance: total scans, unique visitors, geographic spread, device types, timing patterns, and AI-powered insights.
Stop guessing whether your QR code campaigns work. Start measuring, start optimising, and start making data-driven decisions about your print marketing. Your first month is completely free.