You've created QR codes for your business, but are you actually analysing the data behind every scan? Most businesses print QR codes and hope for the best, with no idea whether their codes are being scanned ten times or ten thousand times. Free QR code analytics changes that completely, giving you real-time data on every scan without spending a penny in your first month.
This guide covers everything you need to know about free QR code analytics: what data you can collect, how to interpret it, and how to use scan insights to make smarter marketing decisions.
What Are QR Code Analytics?
QR code analytics is the collection and analysis of data generated when someone scans your QR code. When you use a dynamic QR code with built-in tracking, every scan generates a data point containing information about the scan: when it happened, where the scanner was located, and what device they used.
This transforms a simple printed square into a measurable marketing channel. Instead of guessing whether your flyers, posters, or packaging are driving engagement, you can see the evidence in real numbers.
Free QR Code Analytics with QR Insights
QR Insights provides a completely free first month of analytics with no feature restrictions. From day one, you get access to the same powerful analytics dashboard used by businesses tracking thousands of scans. Here's what's included:
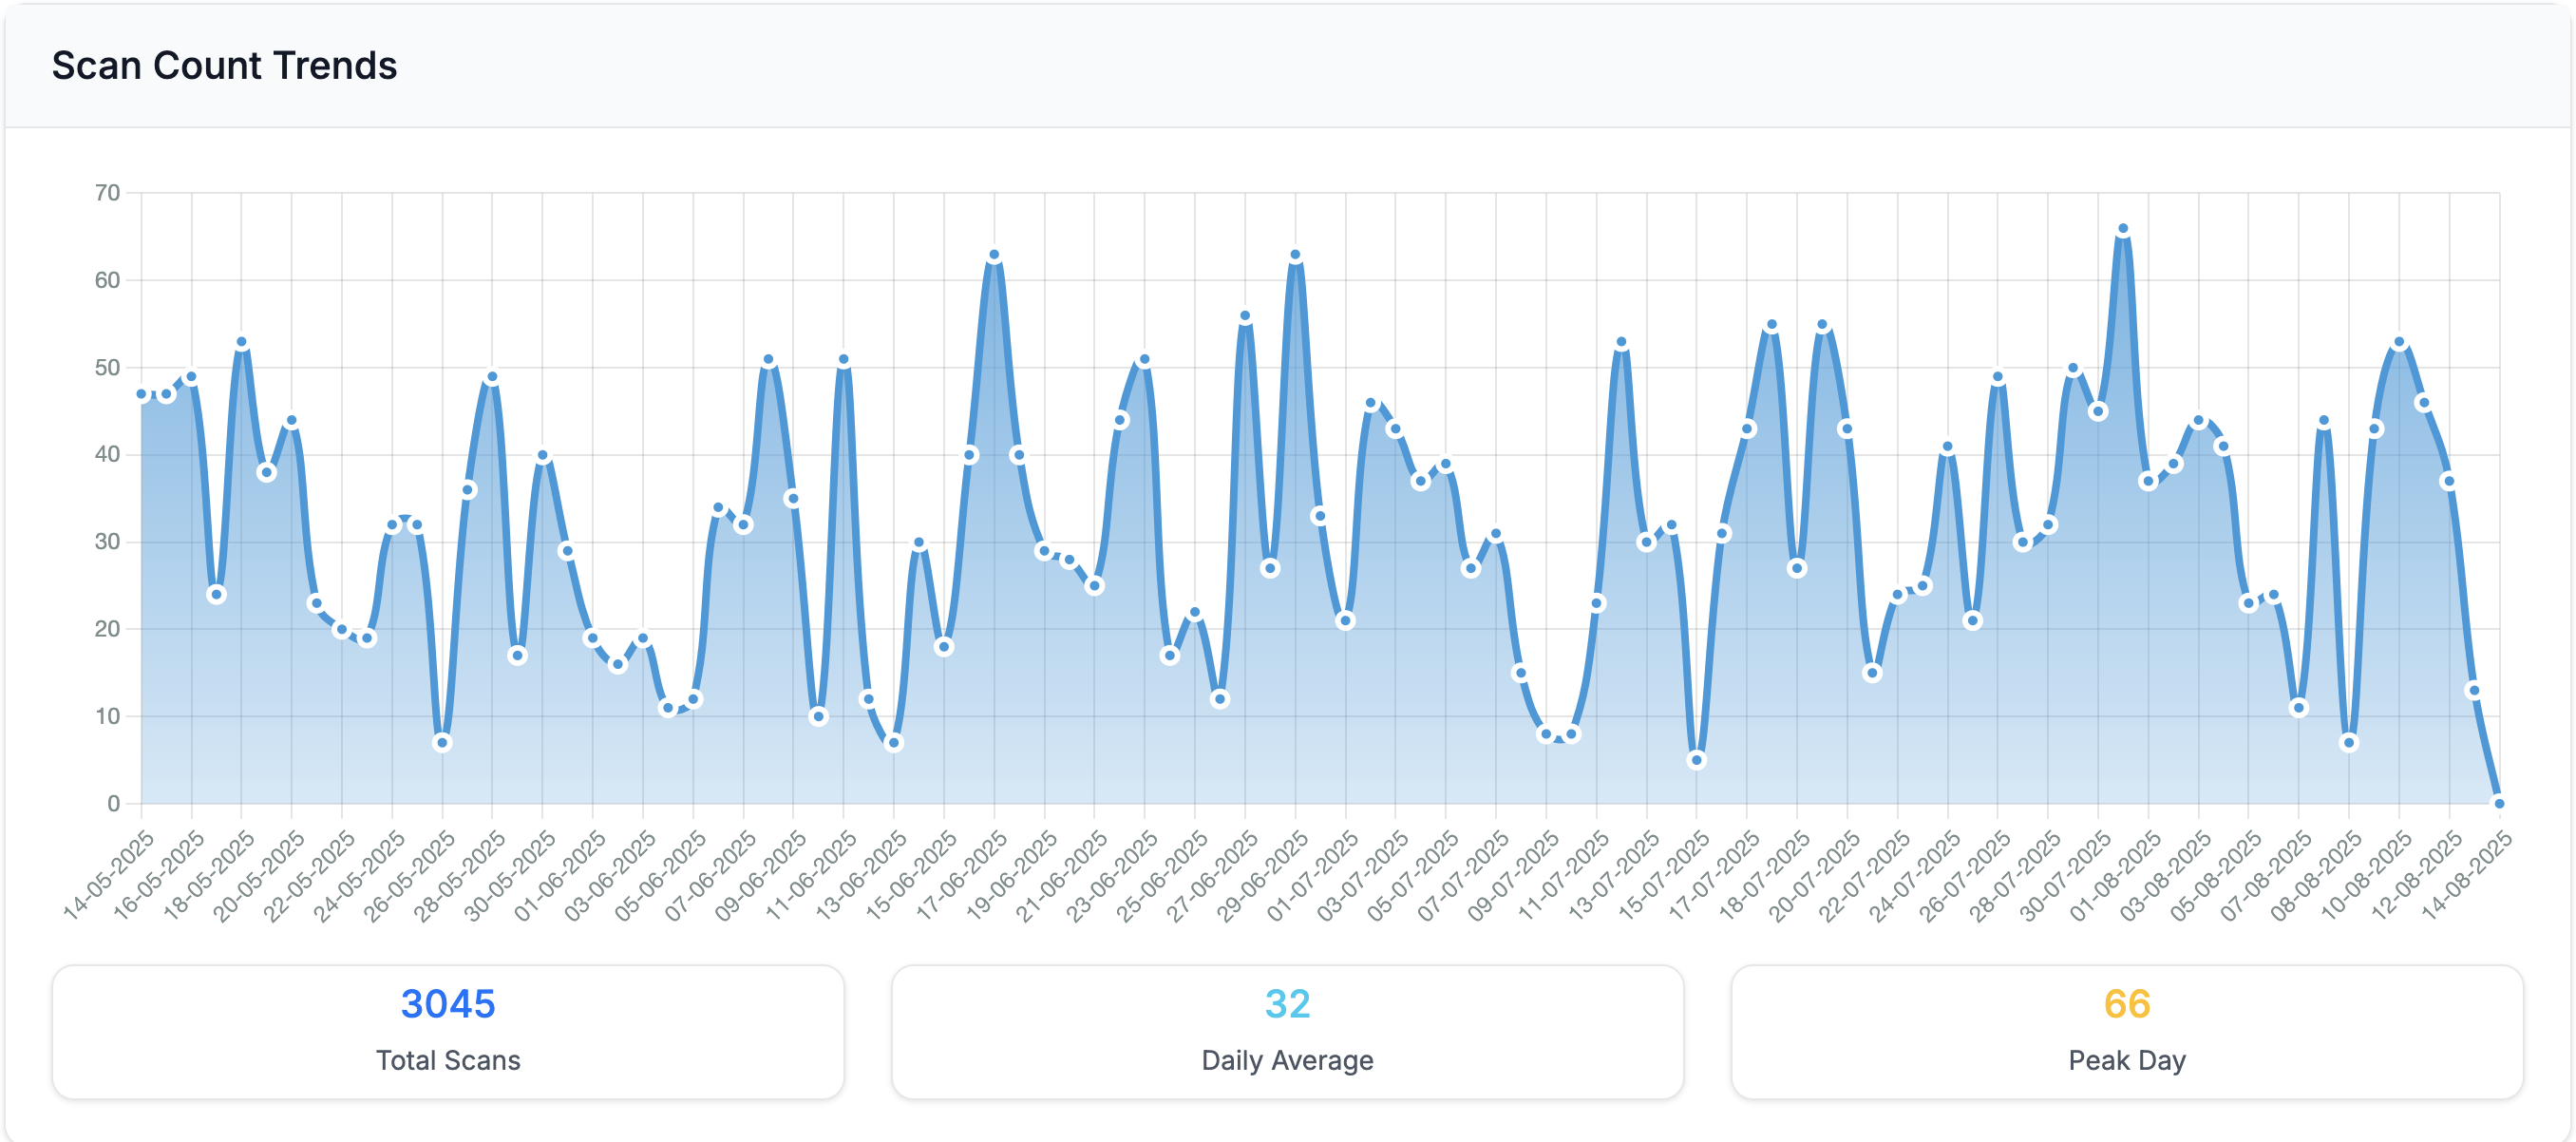
Scan Count Tracking
The foundation of QR code analytics is knowing how many times your code has been scanned. QR Insights tracks both total scans and unique scans, so you can distinguish between new visitors and people returning to scan your code again.
Why does this matter? A poster that gets 500 total scans but only 50 unique scans tells a very different story from one with 500 total scans and 450 unique scans. The first suggests a small but highly engaged audience; the second indicates broad reach.
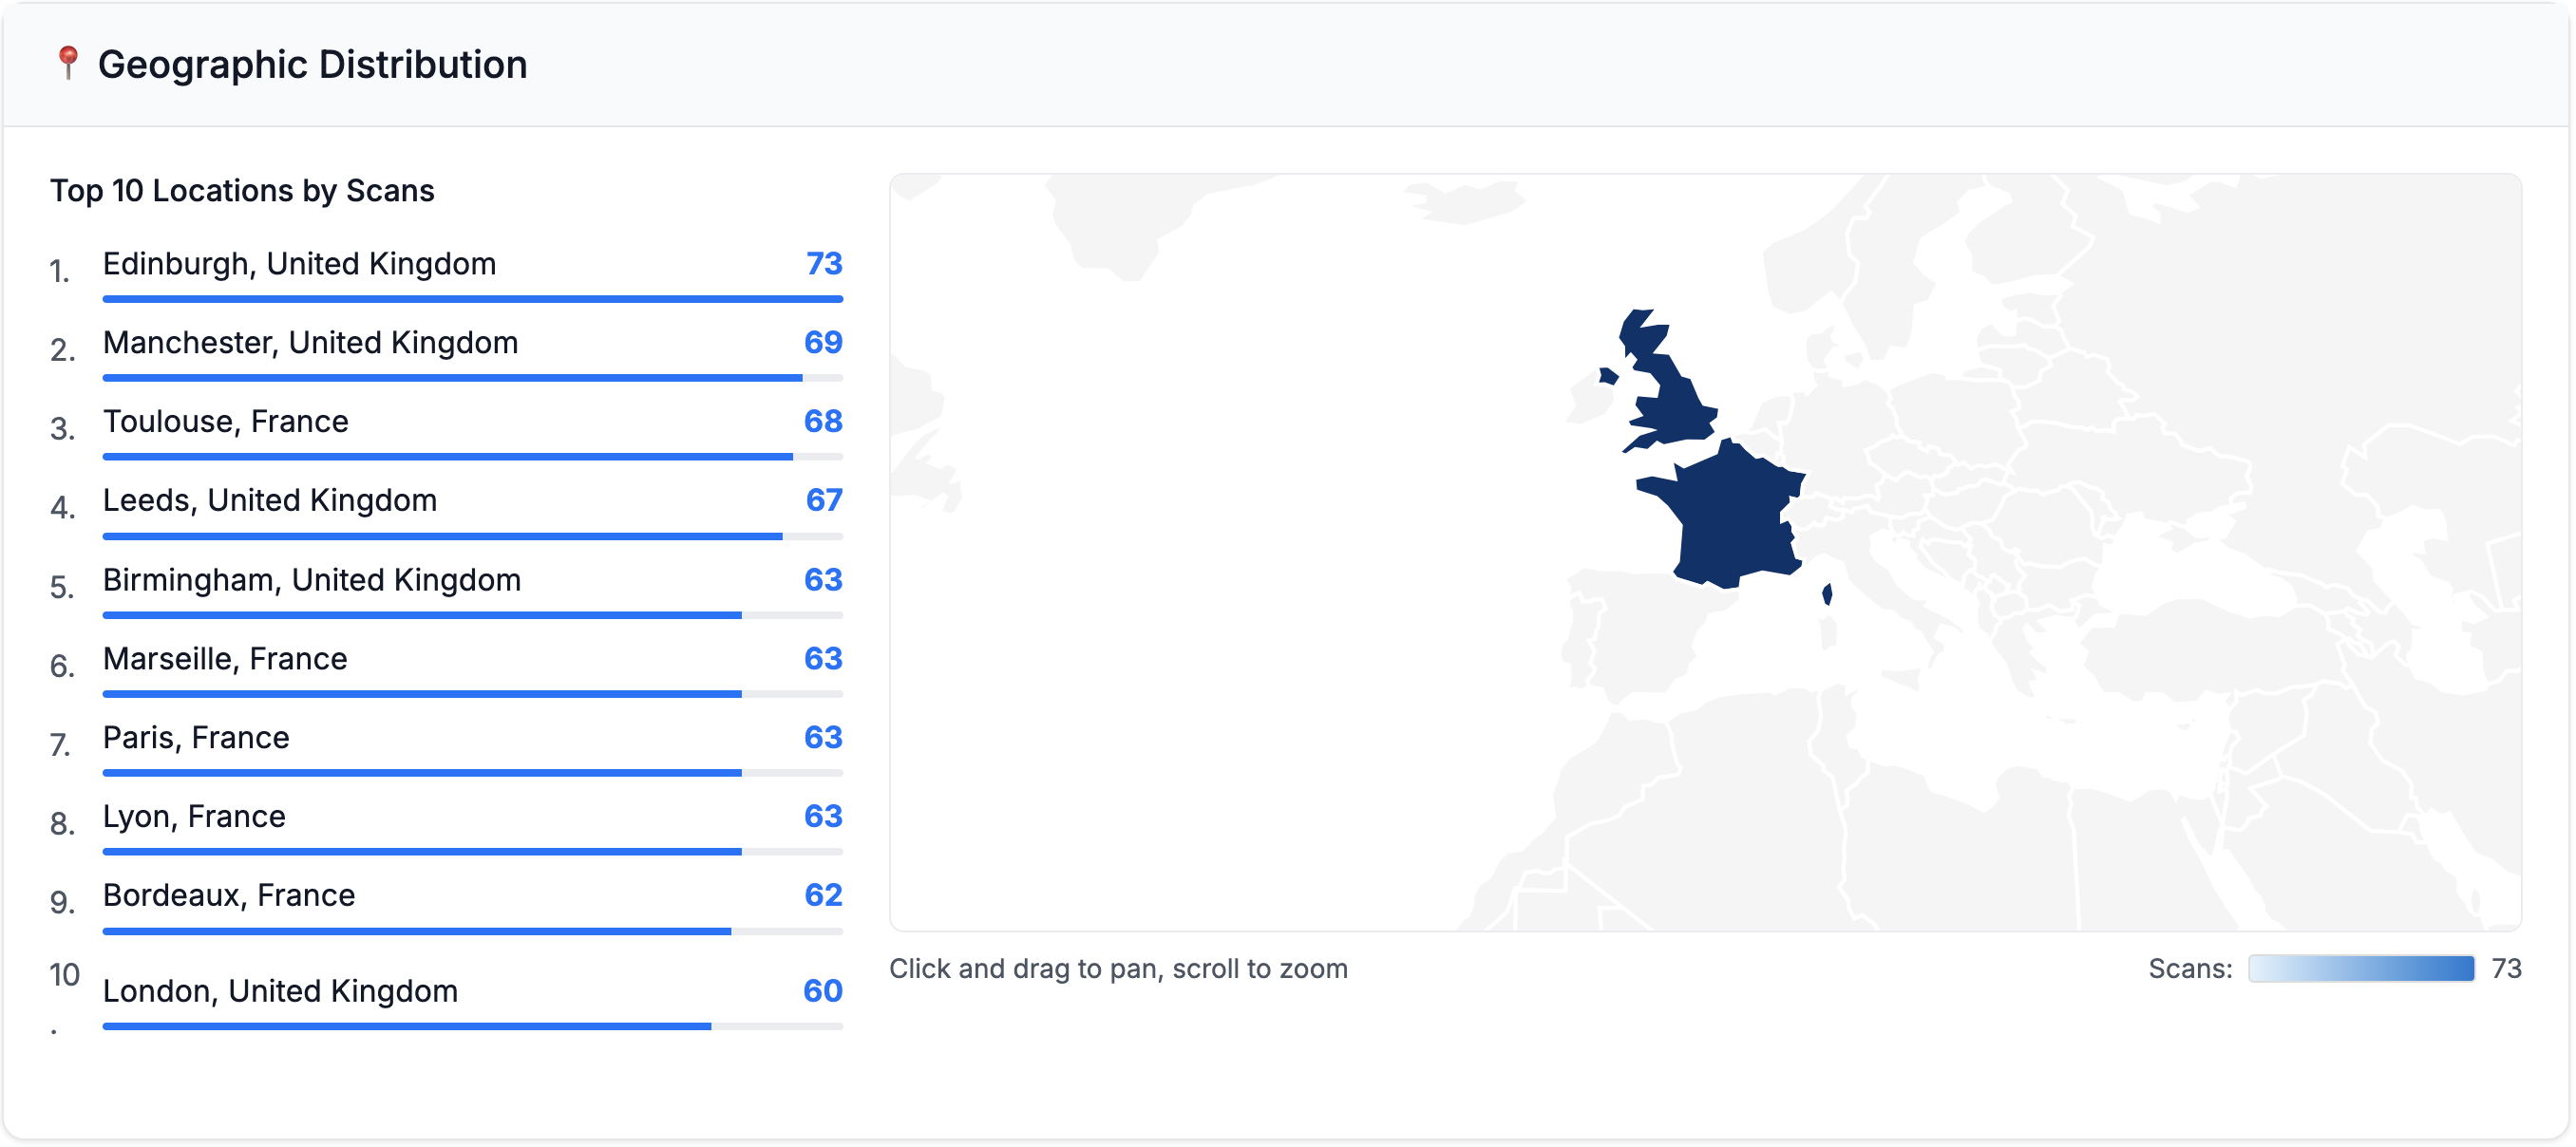
Geographic Analytics
See exactly where your QR code scans are coming from. QR Insights provides location data broken down by city and country, giving you a clear picture of your audience's geographic distribution.
This data is invaluable for businesses with physical marketing materials. If you've placed flyers in three different neighbourhoods, geographic analytics show you exactly which areas are generating the most engagement, so you know where to focus your next campaign.
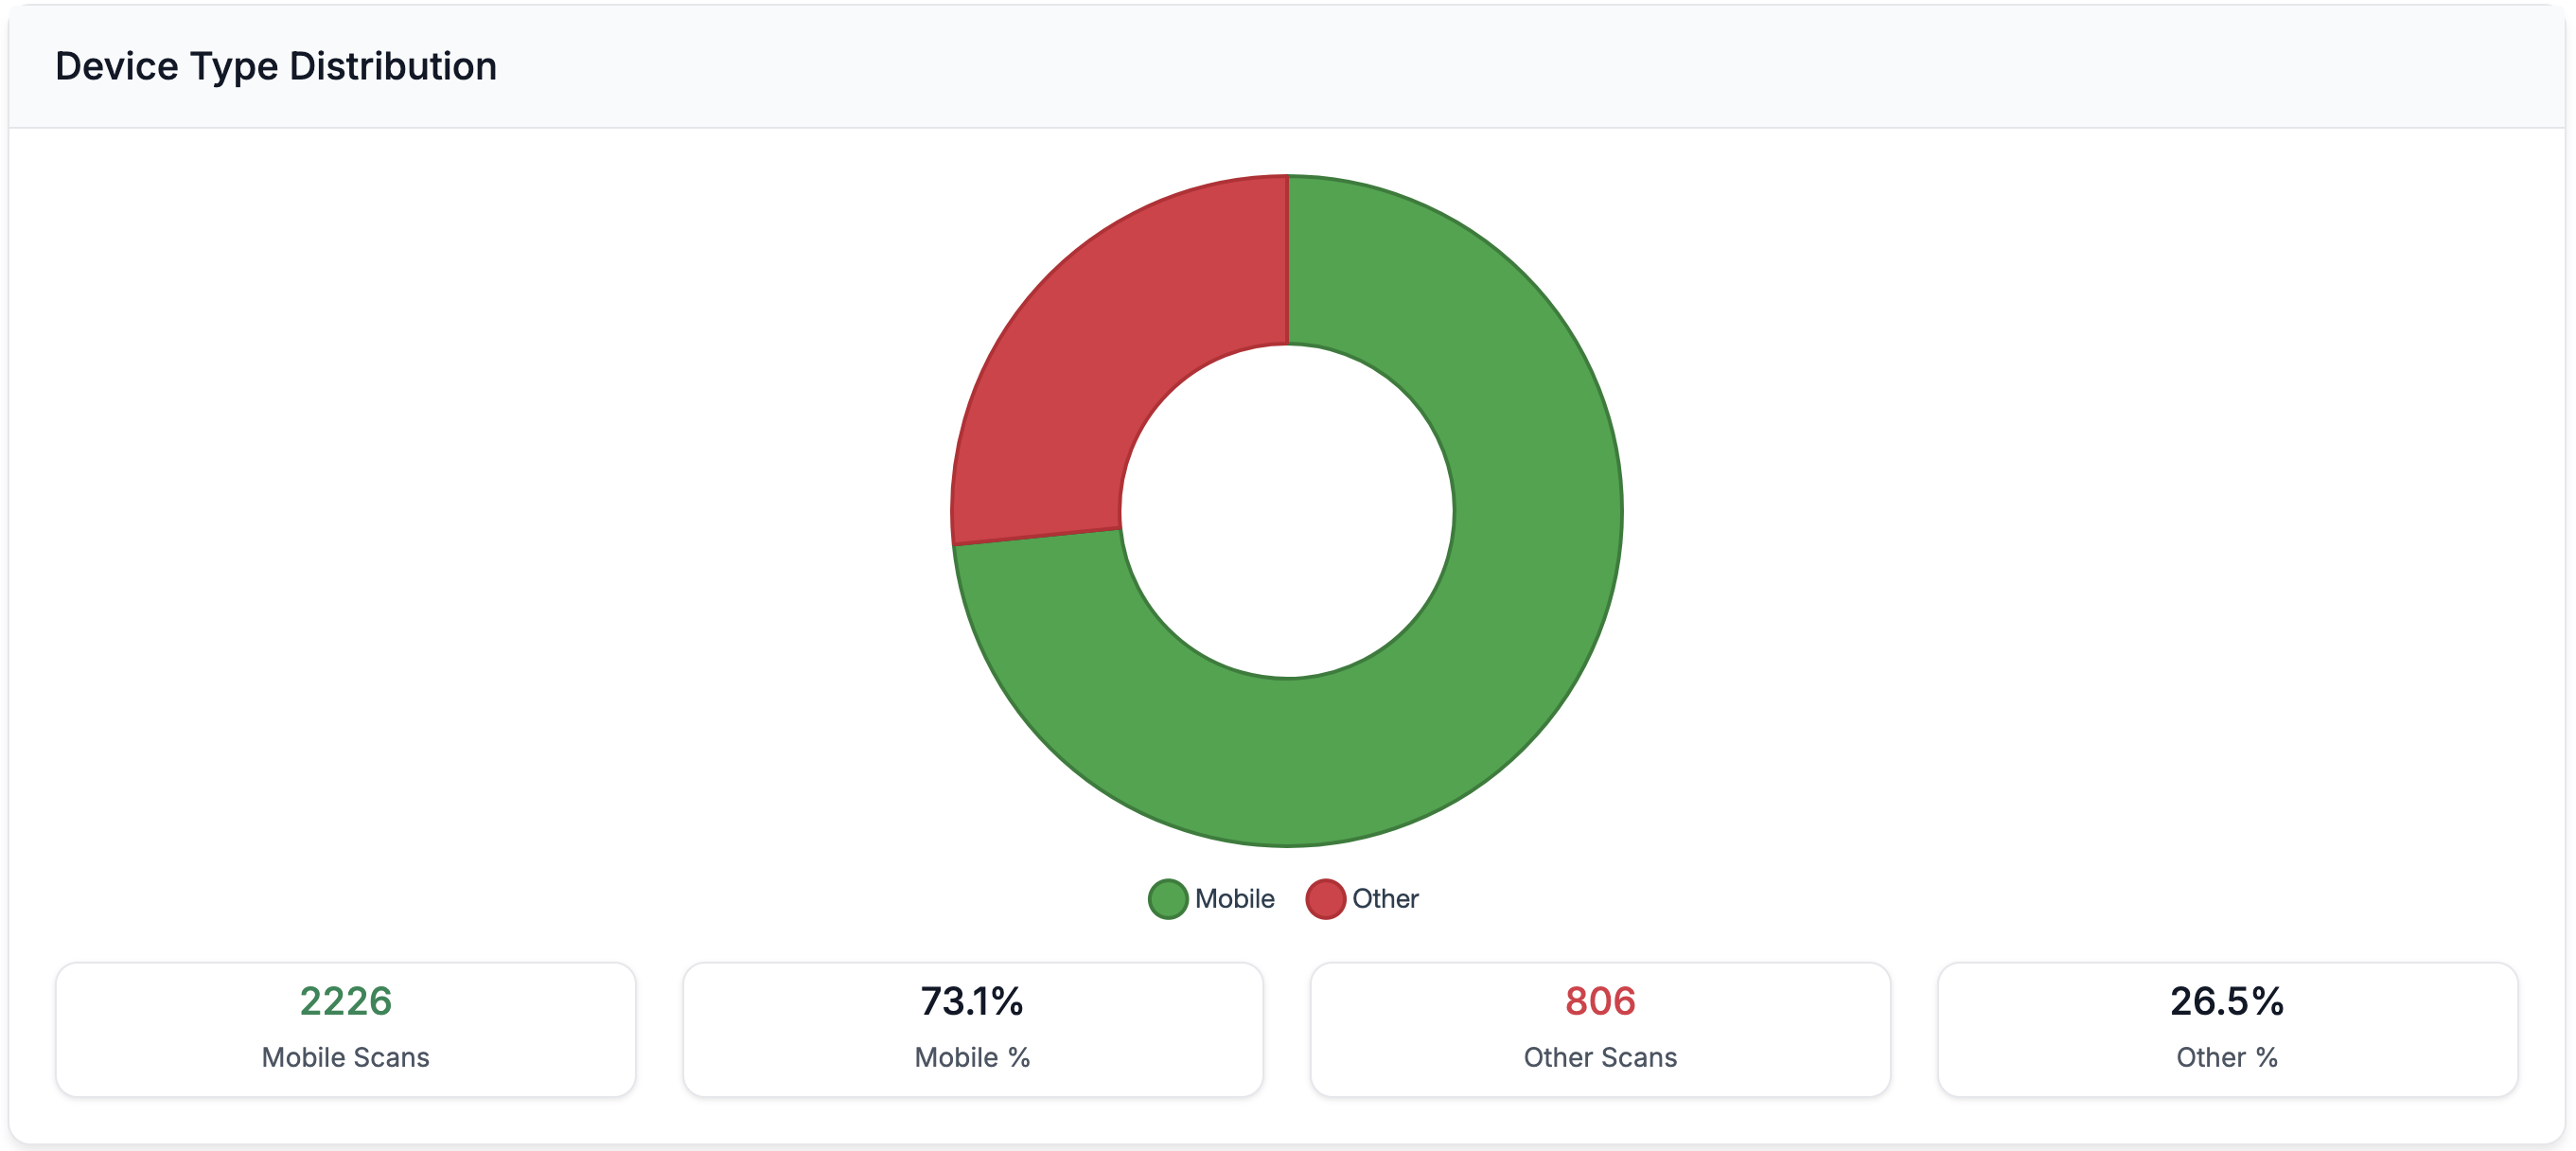
Device Type Breakdown
Every scan records the device type used. QR Insights shows you the split between iOS, Android, and desktop scans. This might seem like a minor detail, but it has practical implications:
- Landing page optimisation: if 80% of your scans come from iPhones, prioritise testing on iOS Safari
- Audience demographics: device preferences can indicate demographic patterns in your market
- App compatibility: if you're linking to an app, know which platform your audience is on
Scan Timing Patterns
When are people scanning your QR codes? QR Insights tracks scan timestamps so you can identify peak engagement hours and days. This helps you:
- Schedule social media posts to coincide with high-engagement periods
- Time promotional updates for maximum visibility
- Understand whether your audience engages during commute hours, lunch breaks, or evenings
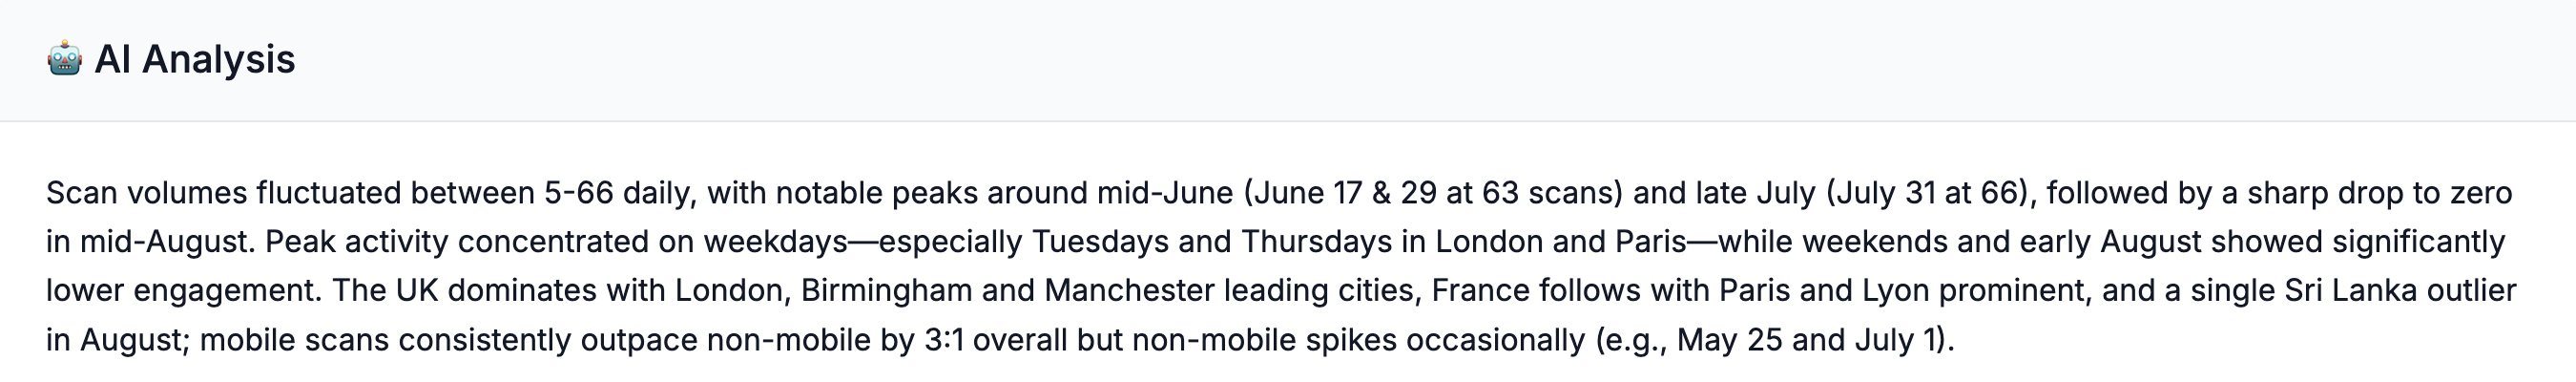
AI-Powered Insights
Raw data is useful, but interpreted data is powerful. QR Insights includes AI-powered analysis that examines your scan patterns and provides actionable recommendations. Instead of staring at charts wondering what they mean, you get clear guidance on what's working and what to change.
How to Use QR Code Analytics to Improve Campaigns
Collecting data is only half the equation. Here's how to put your free QR code scan statistics to work:
Compare Placement Performance
Create separate QR codes for different locations or materials. If you have flyers in a coffee shop, posters at a bus stop, and stickers on packaging, each gets its own trackable code. After a week, your analytics will show which placement drives the most scans.
Optimise Timing
If your scan data shows most engagement happens on weekday mornings, you know your QR codes are reaching commuters. Use this insight to tailor your landing page content, perhaps with quick-read messaging rather than long-form content.
Test and Iterate
With dynamic QR codes, you can change the destination URL without reprinting. Test different landing pages and monitor which version generates more post-scan engagement. Your analytics dashboard shows the impact of every change.
Report to Stakeholders
Whether you're reporting to a client, a manager, or yourself, QR code analytics provide concrete numbers to justify marketing spend. "Our flyer campaign generated 347 scans from 12 locations, with peak engagement between 8-9am on weekdays" is far more compelling than "we distributed 1,000 flyers."
Pro Tip: Set a baseline during your free trial month. Track scan performance for 30 days to establish what "normal" looks like for your campaigns. This baseline becomes invaluable for measuring the impact of future changes and optimisations.
Free QR Code Analytics vs Paid Plans
With QR Insights, the free trial gives you exactly the same features as the paid plan. There are no restricted metrics, no watermarked reports, and no scan limits. You get 30 days of full-featured analytics to evaluate whether scan tracking adds value to your marketing.
After the trial, the subscription is £1.99/month per QR code, with no contracts and the ability to cancel at any time. For context, that's less than the cost of a single coffee per week for unlimited analytics on your QR code campaign.
Getting Started with Free QR Code Analytics
Every QR code you print without tracking is a missed opportunity to learn about your audience. With free QR code analytics from QR Insights, you can start collecting scan data today and turn every printed QR code into a measurable marketing asset.
Sign up with Google, generate your first trackable QR code, and start seeing scan data flow into your analytics dashboard, all completely free for your first 30 days.