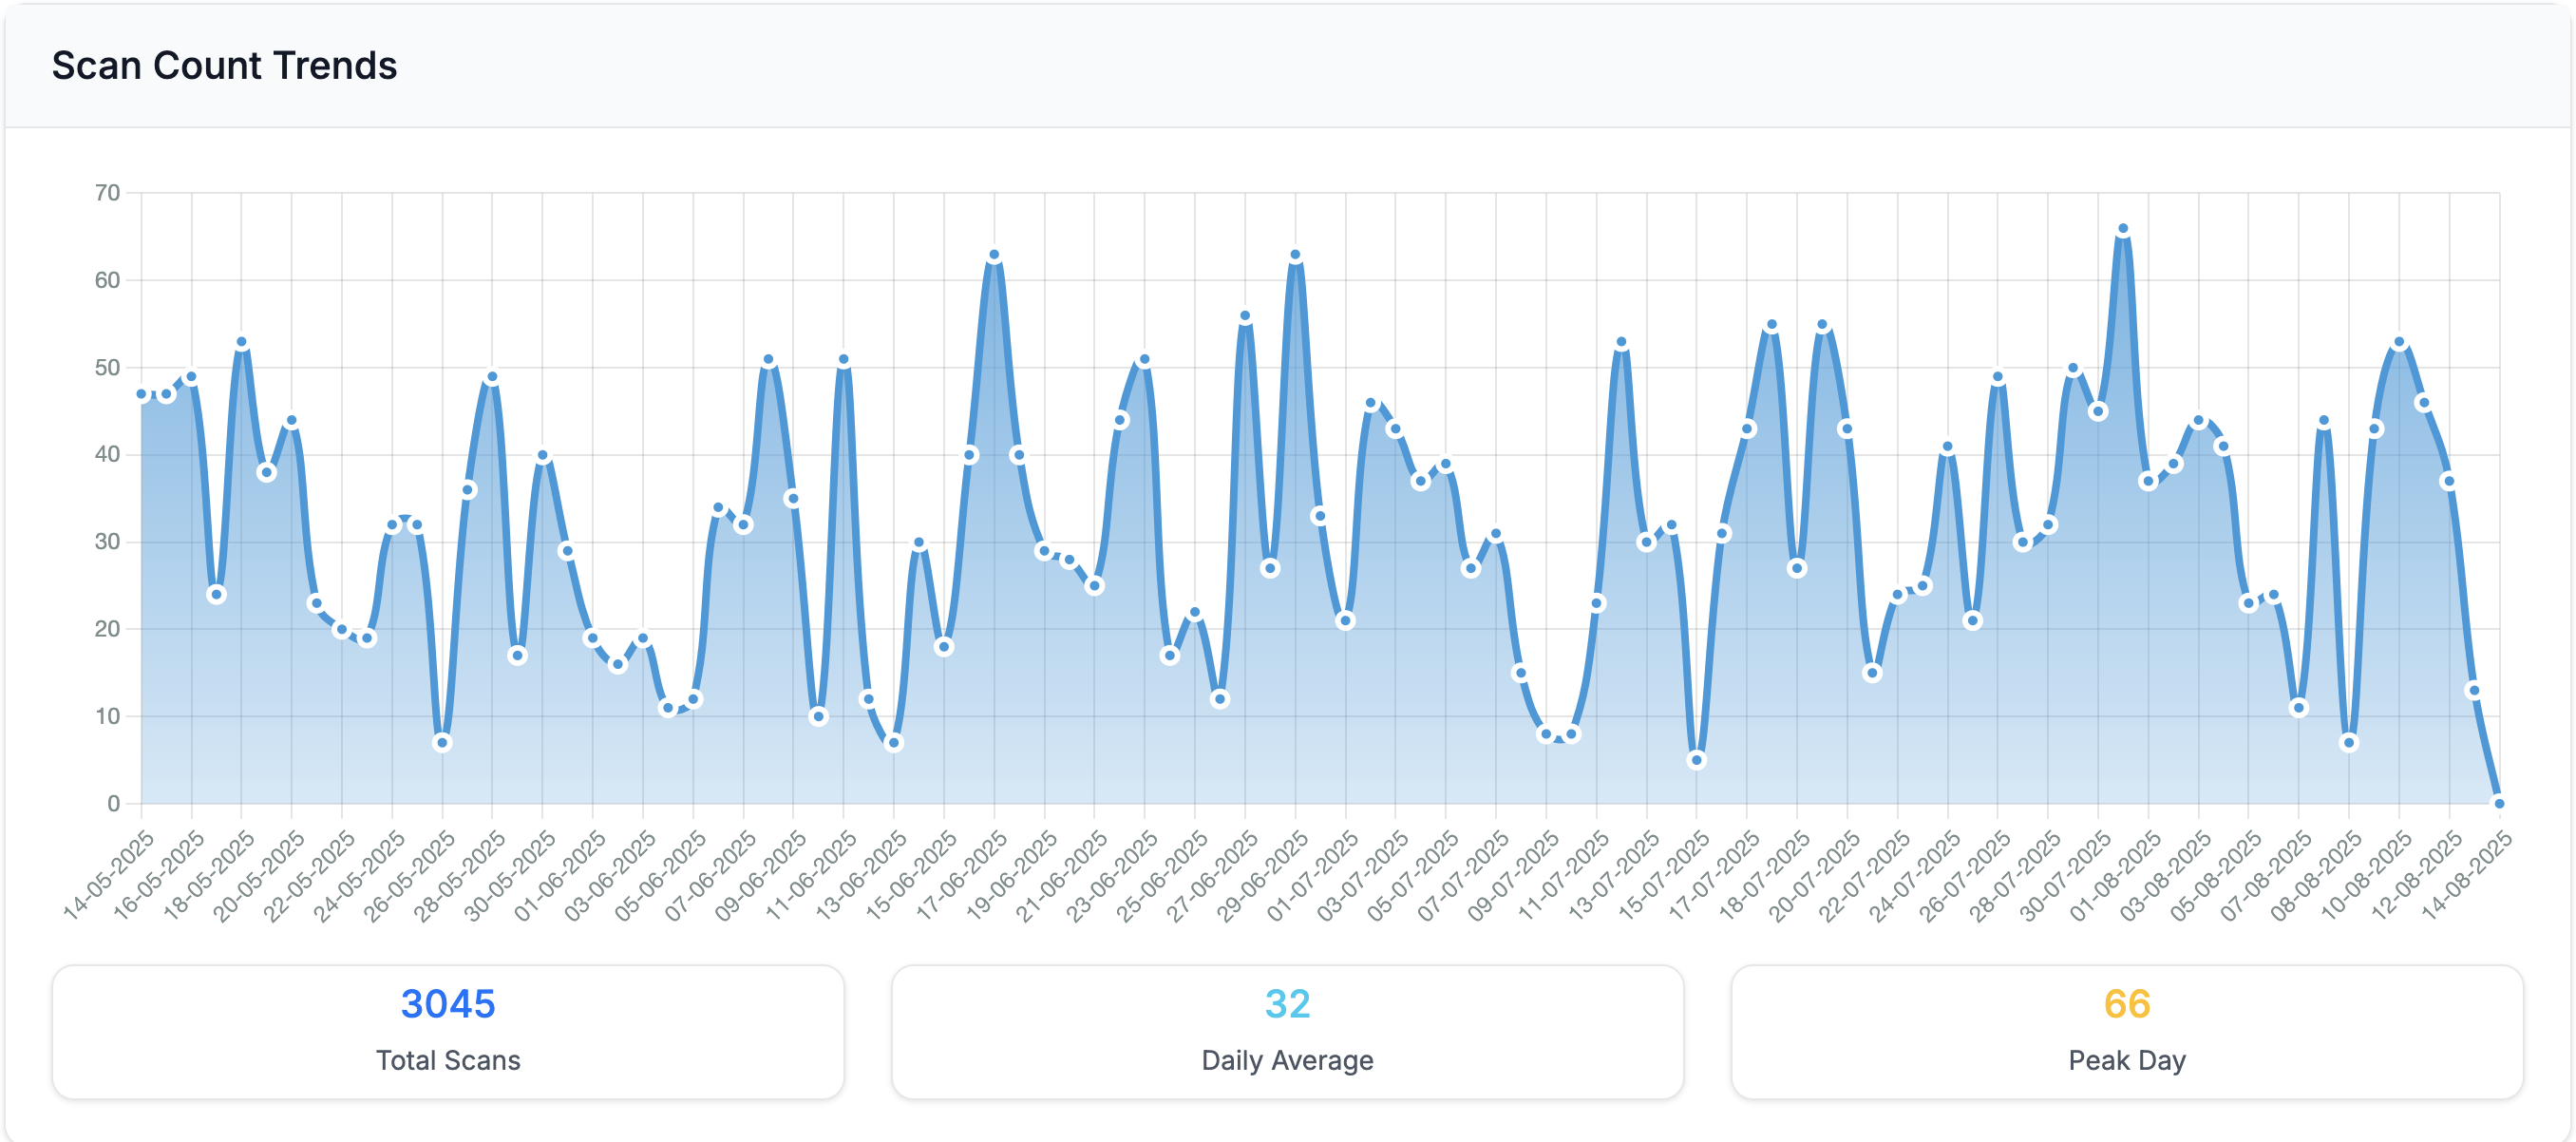
Scan Count Trends
Track daily scan patterns with interactive line charts showing total scans, daily averages, and peak performance identification.
Dashboard overview and metrics
New data is available at the start of each day. Please be patient while we wrangle and aggregate all your data for the most accurate insights.
Your QR code subscription includes comprehensive analytics to help you understand user behavior, track performance, and optimize your campaigns. Explore detailed insights across multiple dimensions including time trends, device types, and geographic distribution.
Track daily scan patterns with interactive line charts showing total scans, daily averages, and peak performance identification.
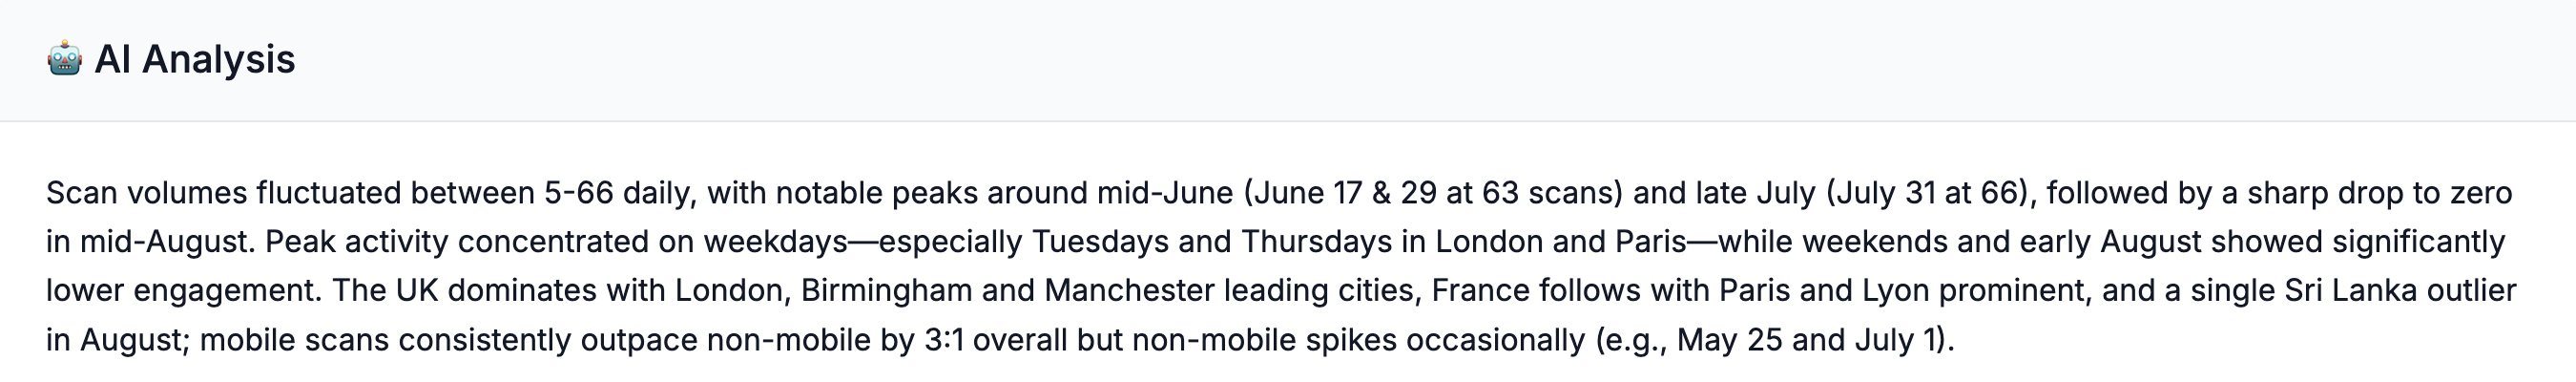
Get intelligent analysis and actionable recommendations based on your QR code performance patterns and emerging trends.
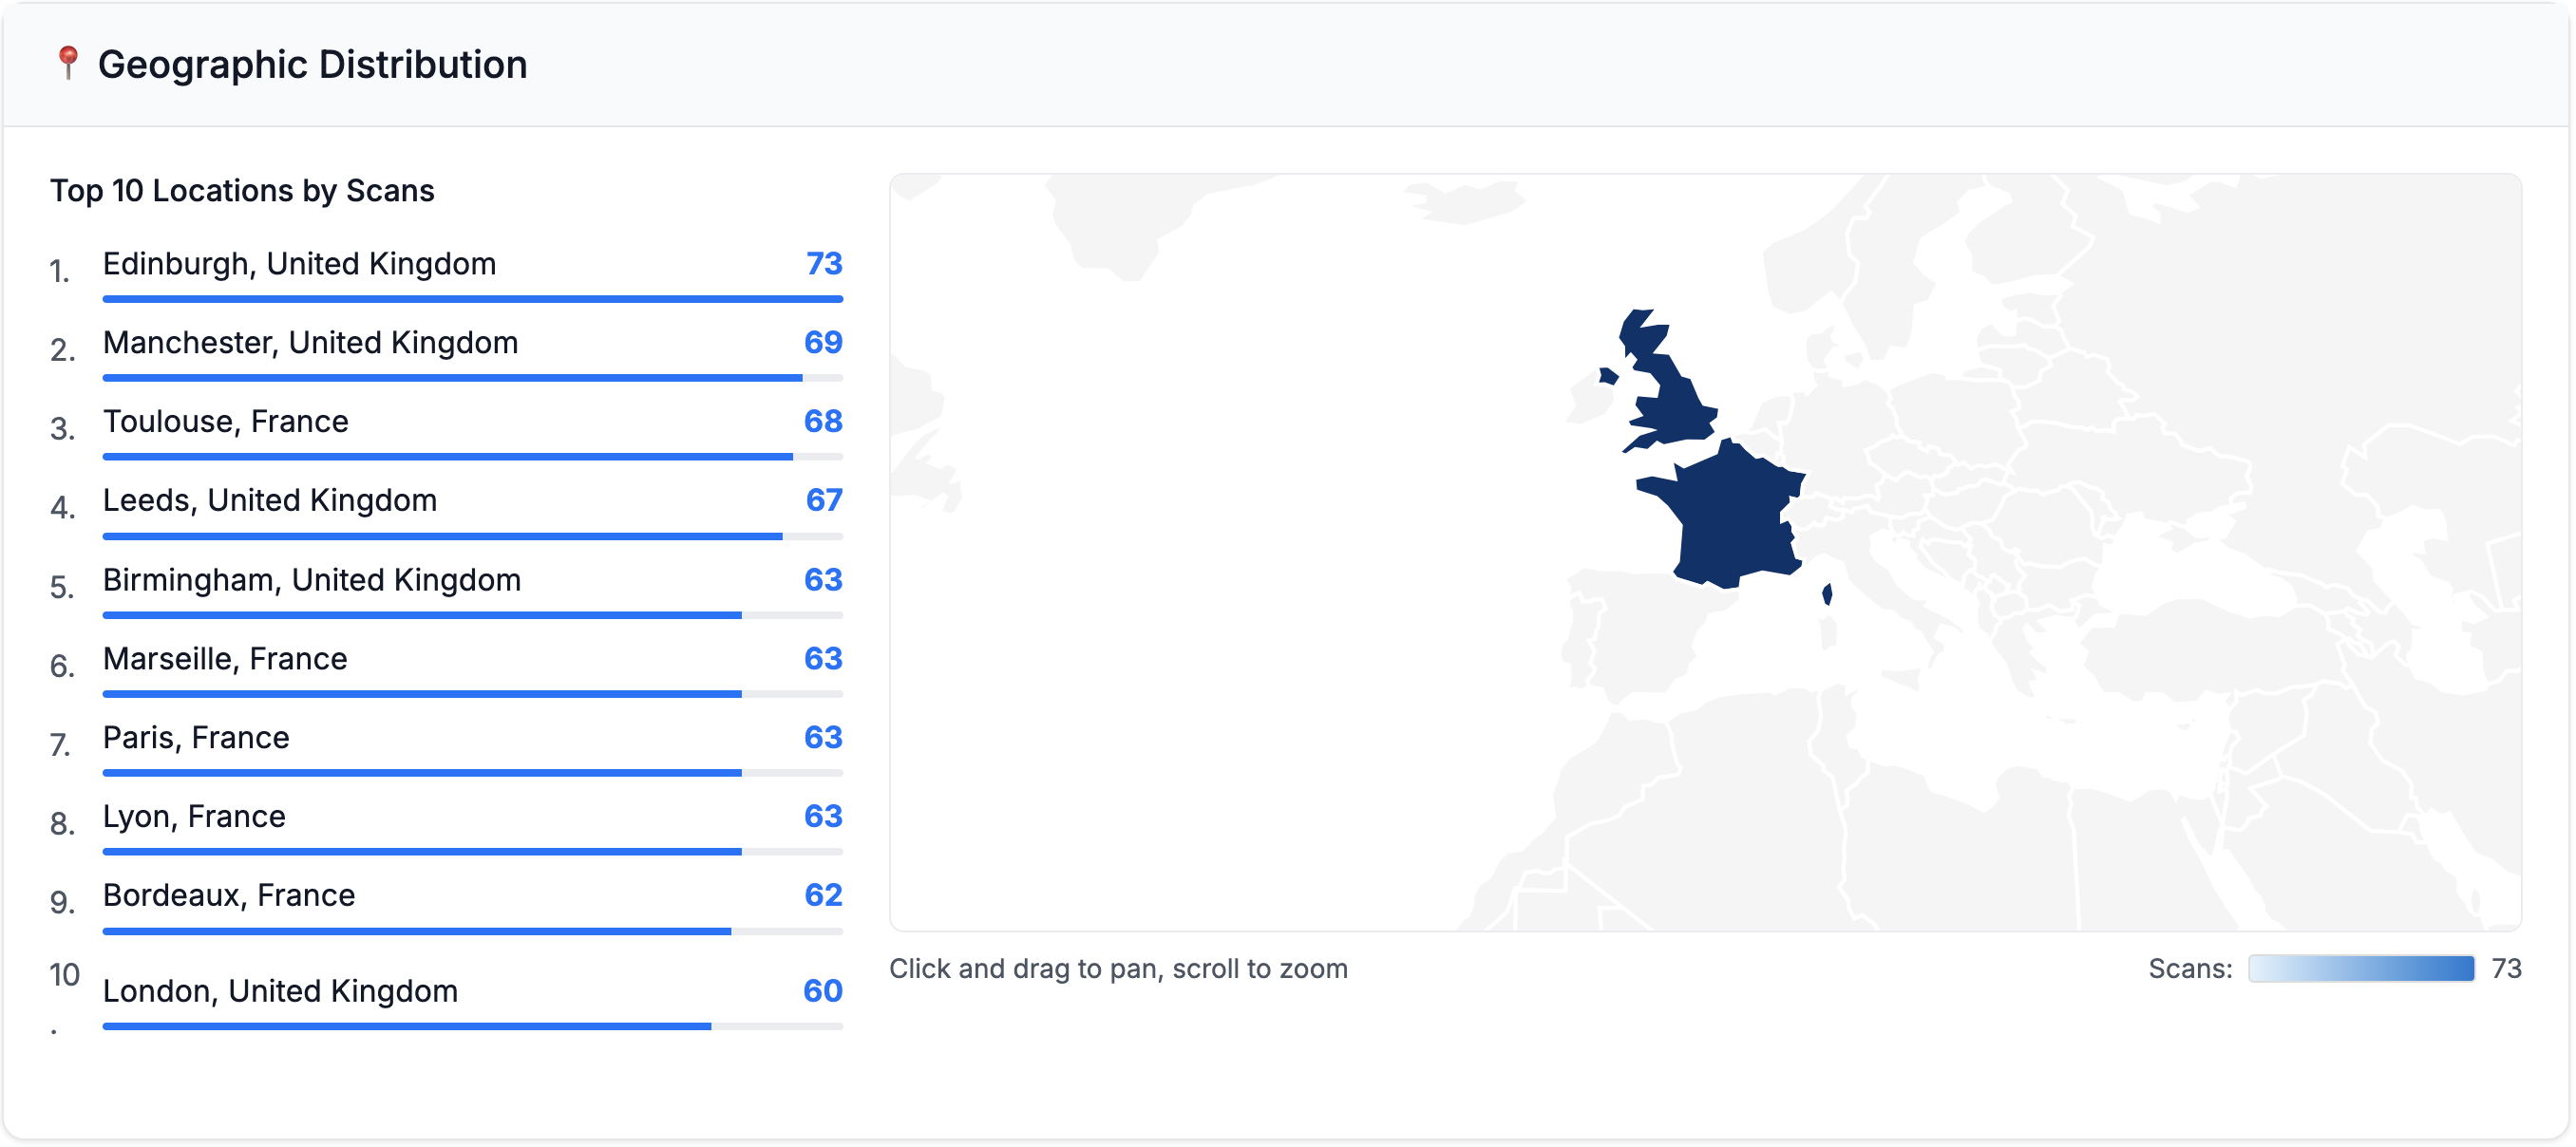
Interactive world maps and location rankings reveal where your global audience is engaging from with city-level insights.
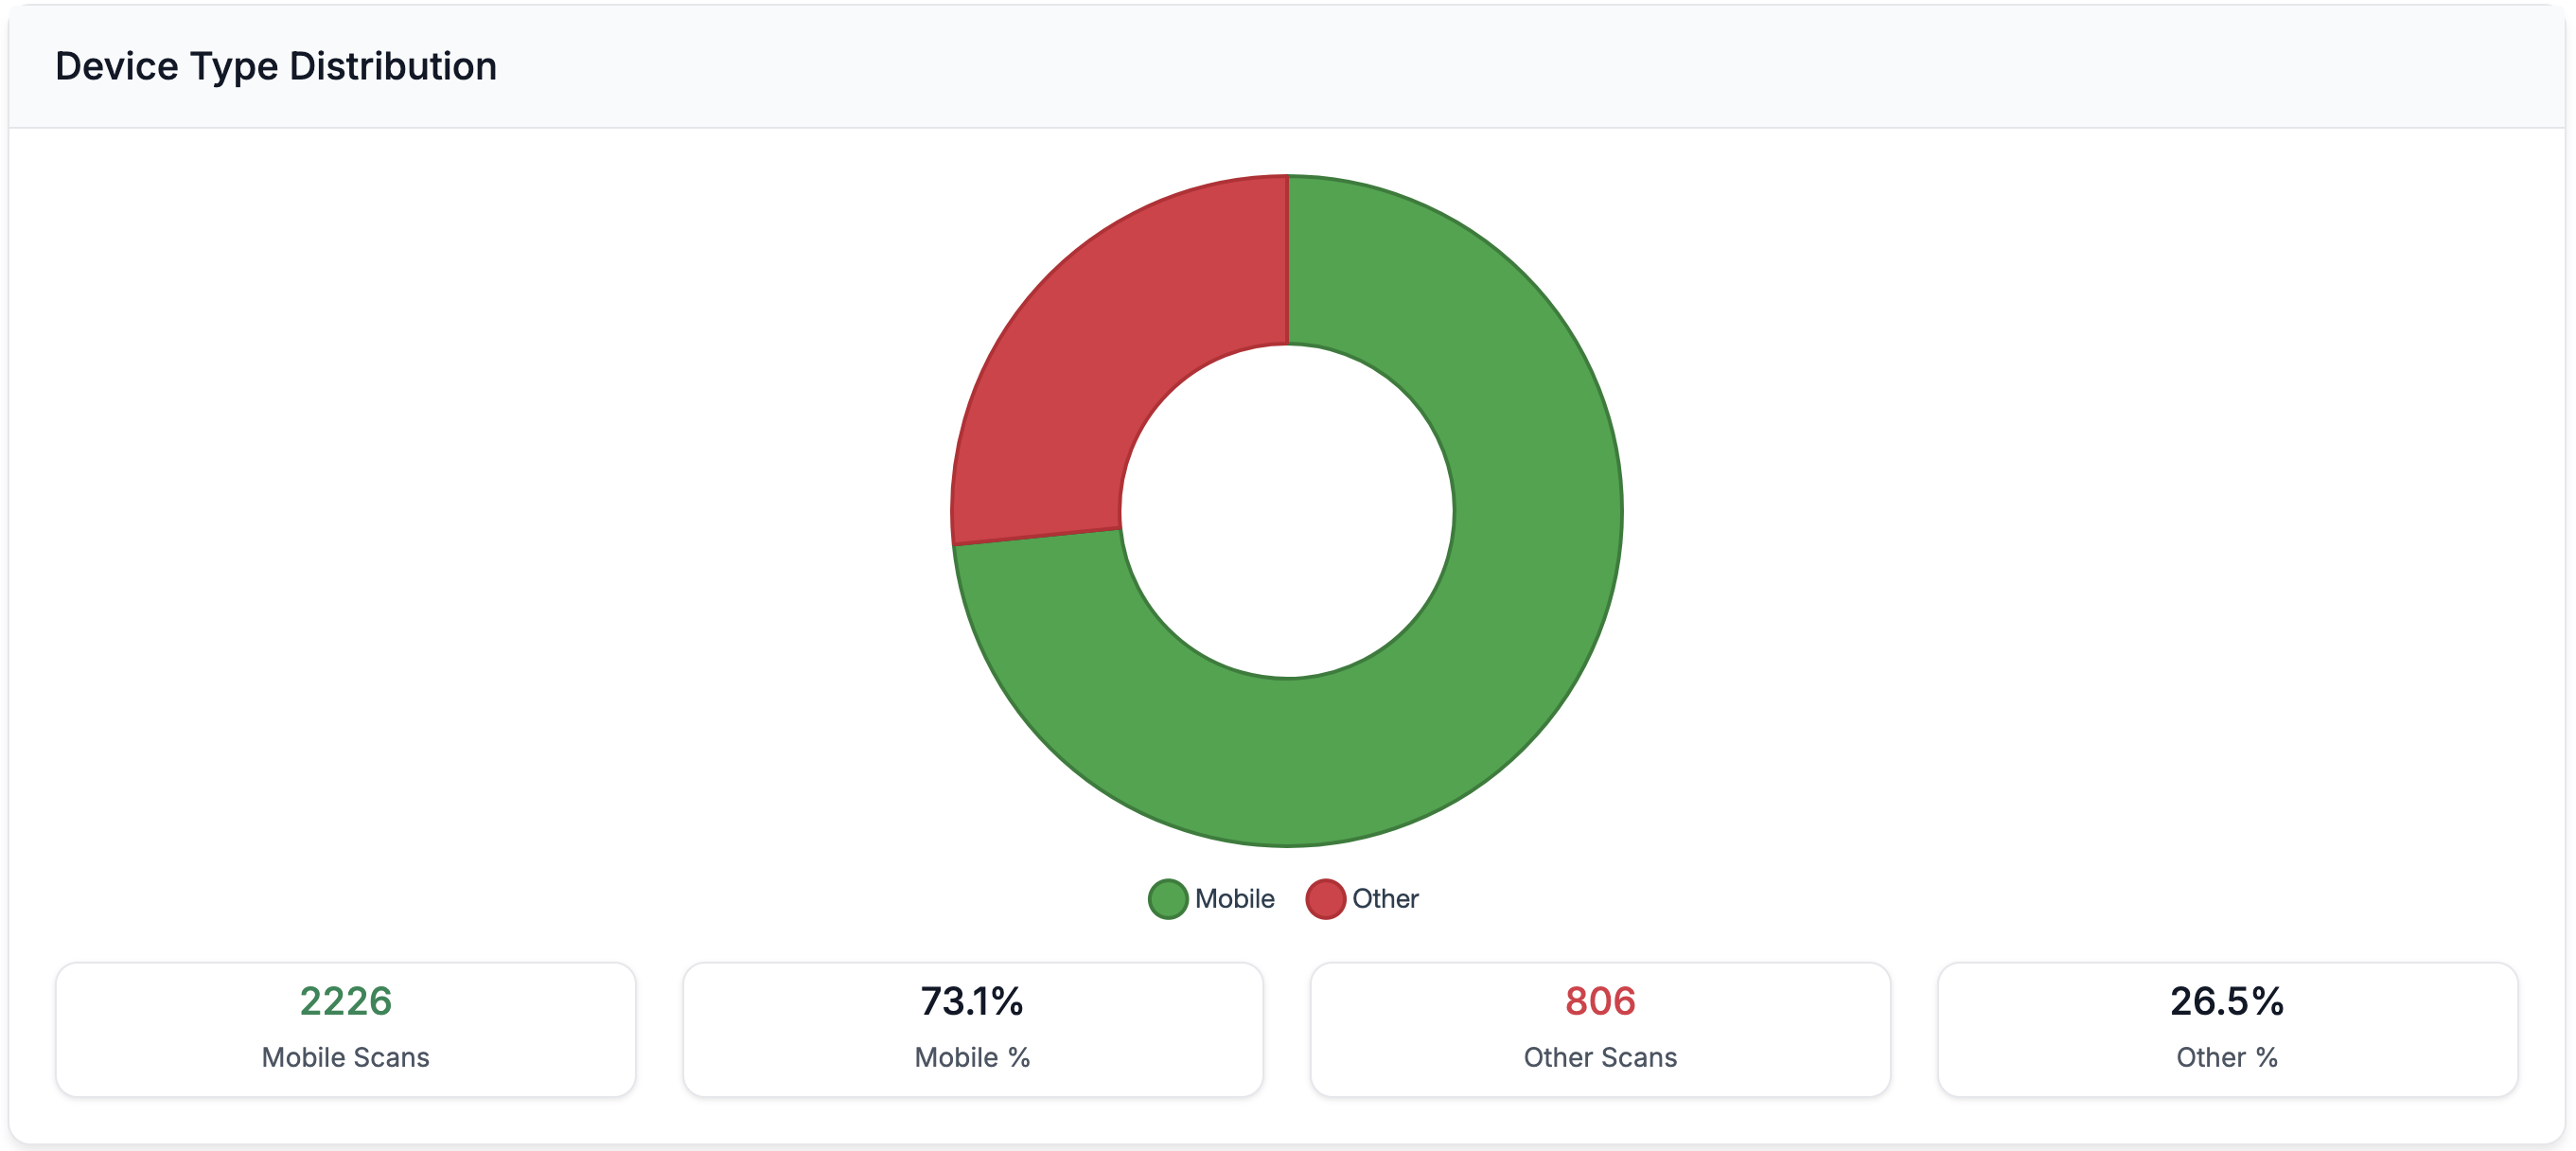
Understand your audience with detailed breakdowns of mobile vs desktop usage patterns with interactive visualizations.
Looking for real-time insights, advanced reporting, or raw data exports? Our sales team can help you unlock premium analytics features.
Contact SalesOur support team is here to help you get the most out of your QR Insights analytics dashboard.
Contact Support